Market Outlook
March 21, 2017
Market Cues
Domestic Indices
Chg (%)
(Pts)
(Close)
Indian markets are likely to open with a flat to positive bias tracking the SGX Nifty.
BSE Sensex
(0.4)
(130)
29,519
U.S. Markets closed mixed on Monday, with utilities lagging, while investors turned
Nifty
(0.4)
(33)
9,127
their eyes to comments from several Federal Reserve officials.
Mid Cap
0.2
24
13,917
The European markets dipped at the open Monday, but remained locked in a
Small Cap
0.3
42
14,055
narrow range throughout the session. The majority of the markets ended the session
Bankex
(0.4)
(101)
24,050
in the red, but none strayed too far from the flat line. Investors were in a cautious
mood ahead of tonight's Presidential debate in France.
Global Indices
Chg (%)
(Pts)
(Close)
Indian markets followed Asian and European peers lower on Monday as oil futures
Dow Jones
(0.0)
(9)
20,906
extended losses on supply concerns and investors awaited a raft of speeches by
Nasdaq
0.0
1
5,902
Federal Reserve officials this week for clues about the global interest rate outlook.
FTSE
0.1
5
7,430
News Analysis
Nikkei
(0.3)
(69)
19,522
IL&FS Engineering Services gets `223cr order for rural electrification jobs in
Hang Seng
0.8
192
24,502
Jharkhand
Shanghai Com
0.4
13
3,251
Larsen arm wins `1,656cr contract from ONGC
Detailed analysis on Pg2
Advances / Declines
BSE
NSE
Investor’s Ready Reckoner
Advances
1,370
795
Key Domestic & Global Indicators
Declines
1,476
863
Stock Watch: Latest investment recommendations on 150+ stocks
Unchanged
197
97
Refer Pg5 onwards
Volumes (` Cr)
Top Picks
CMP
Target
Upside
BSE
56,821
Company
Sector
Rating
(`)
(`)
(%)
NSE
22,580
Amara Raja Batteries Auto & Auto Ancillary
Buy
875
1,009
15.3
HCL Tech
IT
Buy
863
1,000
15.8
Power Grid Corp.
Power
Buy
194
223
15.2
Net Inflows (` Cr)
Net
Mtd
Ytd
Navkar Corp.
Others
Buy
175
265
51.3
FII
1,600
17,690
28,129
KEI Industries
Others
Buy
173
207
19.5
MFs
117
(906)
6,164
More Top Picks on Pg3
Key Upcoming Events
Top Gainers
Price (`)
Chg (%)
Previous
Consensus
Date
Region
Event Description
Pcjeweller
439
5.5
Reading
Expectations
Mar 22, 2017 US
Existing home sales
5.7
5.6
Rtnpower
8
5.4
Mar 23, 2017 Euro Zone Euro-Zone Consumer Confidence
-6.20
-5.9
Bfutilitie
417
4.4
Mar 23, 2017 US
Initial Jobless claims
241.0
240.0
Orientbank
134
4.3
Mar 23, 2017 US
New home sales
555.0
565.0
Denabank
39
4.2
Mar 24, 2017 US
Consumer Confidence
114.8
113.0
Mar 24, 2017 Germany PMI Services
54.4
54.5
Top Losers
Price (`)
Chg (%)
Mar 28, 2017 Germany PMI Manufacturing
56.8
56.5
More Events on Pg4
Idea
98
(9.6)
Jpassociat
13
(6.4)
Deltacorp
161
(5.8)
Indianb
270
(4.7)
Repcohome
675
(4.6)
As on March 20, 2017
Market Outlook
March 21, 2017
News Analysis
IL&FS Engineering Services gets
`223cr order for rural
electrification jobs in Jharkhand
IL&FS Engineering and Construction Company has bagged an order worth
`222.7cr for rural electrification works from Jharkhand Bijli Vitran Nigam for
Sahibganj and Pakur districts in the state. The order has been awarded under the
Deen Dayal Upadhyay Gram Jyoti Yojana. It is scheduled to be completed in
24 months.
Larsen arm wins `1,656cr contract from ONGC
The order, which was bagged and will be executed by L&T’s subsidiary, L&T
Hydrocarbon Engineering relates to ONGC’s Neelam Re-Development & B173AC
projects. It entails building of one new process platform having gas processing and
compression facilities, three new well head platforms, 32 km pipeline, clamp-on
on three existing platforms and modification work on eight existing platforms in the
Neelam Field in western offshore basin in India. Larsen & Toubro has bagged an
offshore project order worth `1,656cr from state-run ONGC.
The project, part of ONGC’s strategy to enhance the field life and increase
recovery of Neelam field, is scheduled to be completed by April 2019. The
incremental gain from the field after implementation of project till 2034-35 is
pegged at 2.76 million ton crude oil and 4.786 BCM gas, L&T said. Neelam
Offshore field is situated in the Heera-Panna block in Mumbai Offshore, located at
about 45 km South-West of Mumbai city.
Economic and Political News
UP farm loan waiver: SBI report sees `27,420cr hit on banks
India to attract $4.2 billion global investment: Report
UP farm loan waiver: SBI report sees `27,420cr hit on banks
Corporate News
RCOM gets CCI approval for Aircel merger
Jet Airways signs codeshare agreement with Jetstar Asia
PVR to Launch 10 virtual reality lounges in India
Market Outlook
March 21, 2017
Top Picks ★★★★★
Large Cap
Market Cap
CMP
Target
Upside
Company
Rationale
(` Cr)
(`)
(`)
(%)
To outpace battery industry growth due to better technological
Amara Raja Batteries
14,943
875
1,009
15.3
products leading to market share gains in both the
automotive OEM and replacement segments.
Strong growth in domestic business due to its leadership in
Alkem Laboratories
25,160
2,104
2,257
7.3
acute therapeutic segment. Alkem expects to launch more
products in USA, which bodes for its international business.
The stock is trading at attractive valuations and is factoring all
HCL Tech
1,21,831
863
1,000
15.8
the bad news.
Back on the growth trend, expect a long term growth of 14%
Infosys
2,34,426
1,021
1,249
22.3
to be a US$20bn in FY2020.
Strong order backlog and improvement in execution would
Larsen & Tourbo
1,43,513
1,538
1,700
10.5
trigger the growth for the L&T.
One of the largest pharma companies with strong
Lupin
66,039
1,463
1,809
23.7
international presence. It has a rich pipeline of ANDAs which
is also one of the largest among the generic companies.
Going forward, we expect the company to report strong top-
Power Grid Corporation
1,01,231
194
223
15.2
line CAGR of ~16% and bottom-line CAGR of ~19% over
FY16-18 on back of strong capitalization guidance
Source: Company, AngelResearch
Mid Cap
Market Cap
CMP
Target
Upside
Company
Rationale
(` Cr)
(`)
(`)
(%)
We expect the company would report strong profitability
Asian Granito
1,034
344
351
2.1
owing to better product mix, higher B2C sales and
amalgamation synergy.
Among the top 4 players in the consumer durables segment.
Bajaj Electricals
3,147
311
330
6.1
Improved profitability backed by turn around in E&P segment.
Strong order book lends earnings visibility.
Favourable outlook for the AC industry to augur well for
Cooling products business which is out pacing the market
Blue Star
5,837
611
634
3.8
growth. EMPPAC division's profitability to improve once
operating environment turns around.
Strong loan growth backed by diversified loan portfolio and
Equitas Holdings
5,498
163
235
44.3
adequate CAR. ROE & ROA likely to remain decent as risk of
dilution remains low. Attractive valuations considering growth.
Economic recovery to have favourable impact on advertising
& circulation revenue growth. Further, the acquisition of a
Jagran Prakashan
5,739
176
225
28.2
radio business (Radio City) would also boost the company's
revenue growth.
High order book execution in EPC segment, rising B2C sales
KEI Industries
1,348
173
207
19.5
and higher exports to boost the revenues and profitability
Speedier execution and speedier sales, strong revenue visibilty
Mahindra Lifespace
1,537
375
522
39.4
in short-to-long run, attractive valuations
Higher growth in domestic branded sales and healthy export
Mirza International
1,066
89
107
20.8
to boost the profitability.
Massive capacity expansion along with rail advantage at ICD
Navkar Corporation
2,498
175
265
51.3
as well CFS augurs well for the company
Market leadership in Hindi news genre and no. 2 viewership
ranking in English news genre, exit from the radio business,
TV Today Network
1,521
255
344
34.9
and anticipated growth in ad spends by corporates to benefit
the stock.
Source: Company, Angel Research
Market Outlook
March 21, 2017
Key Upcoming Events
Global economic events release calendar
Bloomberg Data
Date
Time
Country
Event Description
Unit
Period
Last Reported
Estimated
Mar 22, 2017
7:30 PM US
Existing home sales
Million
Feb
5.69
5.56
Mar 23, 2017
8:30 PM Euro Zone Euro-Zone Consumer Confidence
Value
Mar A
-6.20
-5.90
6:00 PM US
Initial Jobless claims
Thousands
Mar 18
241.00
240.00
7:30 PM US
New home sales
Thousands
Feb
555.00
565.00
Mar 24, 2017
7:30 PM US
Consumer Confidence
S.A./ 1985=100
Mar
114.80
113.00
2:00 PM Germany
PMI Services
Value
Mar P
54.40
54.50
Mar 28, 2017
2:00 PM Germany
PMI Manufacturing
Value
Mar P
56.80
56.50
Mar 30, 2017
6:00 PM US
GDP Qoq (Annualised)
% Change
4Q T
1.90
1.90
Mar 31, 2017
1:25 PM Germany
Unemployment change (000's)
Thousands
Mar
-15.00
6:30 AM China
PMI Manufacturing
Value
Mar
51.60
51.20
2:00 PM UK
GDP (YoY)
% Change
4Q F
2.00
Apr 03, 2017
2:00 PM UK
PMI Manufacturing
Value
Mar
54.60
Apr 06, 2017
2:30 PM India
RBI Reverse Repo rate
%
Apr 6
5.75
2:30 PM India
RBI Repo rate
%
Apr 6
6.25
2:30 PM India
RBI Cash Reserve ratio
%
Apr 6
4.00
Apr 07, 2017
2:00 PM UK
Industrial Production (YoY)
% Change
Feb
3.20
6:00 PM US
Unnemployment rate
%
Mar
4.70
4.70
6:00 PM US
Change in Nonfarm payrolls
Thousands
Mar
235.00
175.00
Apr 10, 2017
India
Imports YoY%
% Change
Mar
21.76
India
Exports YoY%
% Change
Mar
17.48
Apr 12, 2017
2:00 PM UK
Jobless claims change
% Change
Mar
(11.30)
5:30 PM India
Industrial Production YoY
% Change
Feb
2.70
7:00 AM China
Consumer Price Index (YoY)
% Change
Mar
0.80
Apr 13, 2017
US
Producer Price Index (mom)
% Change
Mar
0.10
Source: Bloomberg, Angel Research
Market Outlook
March 21, 2017
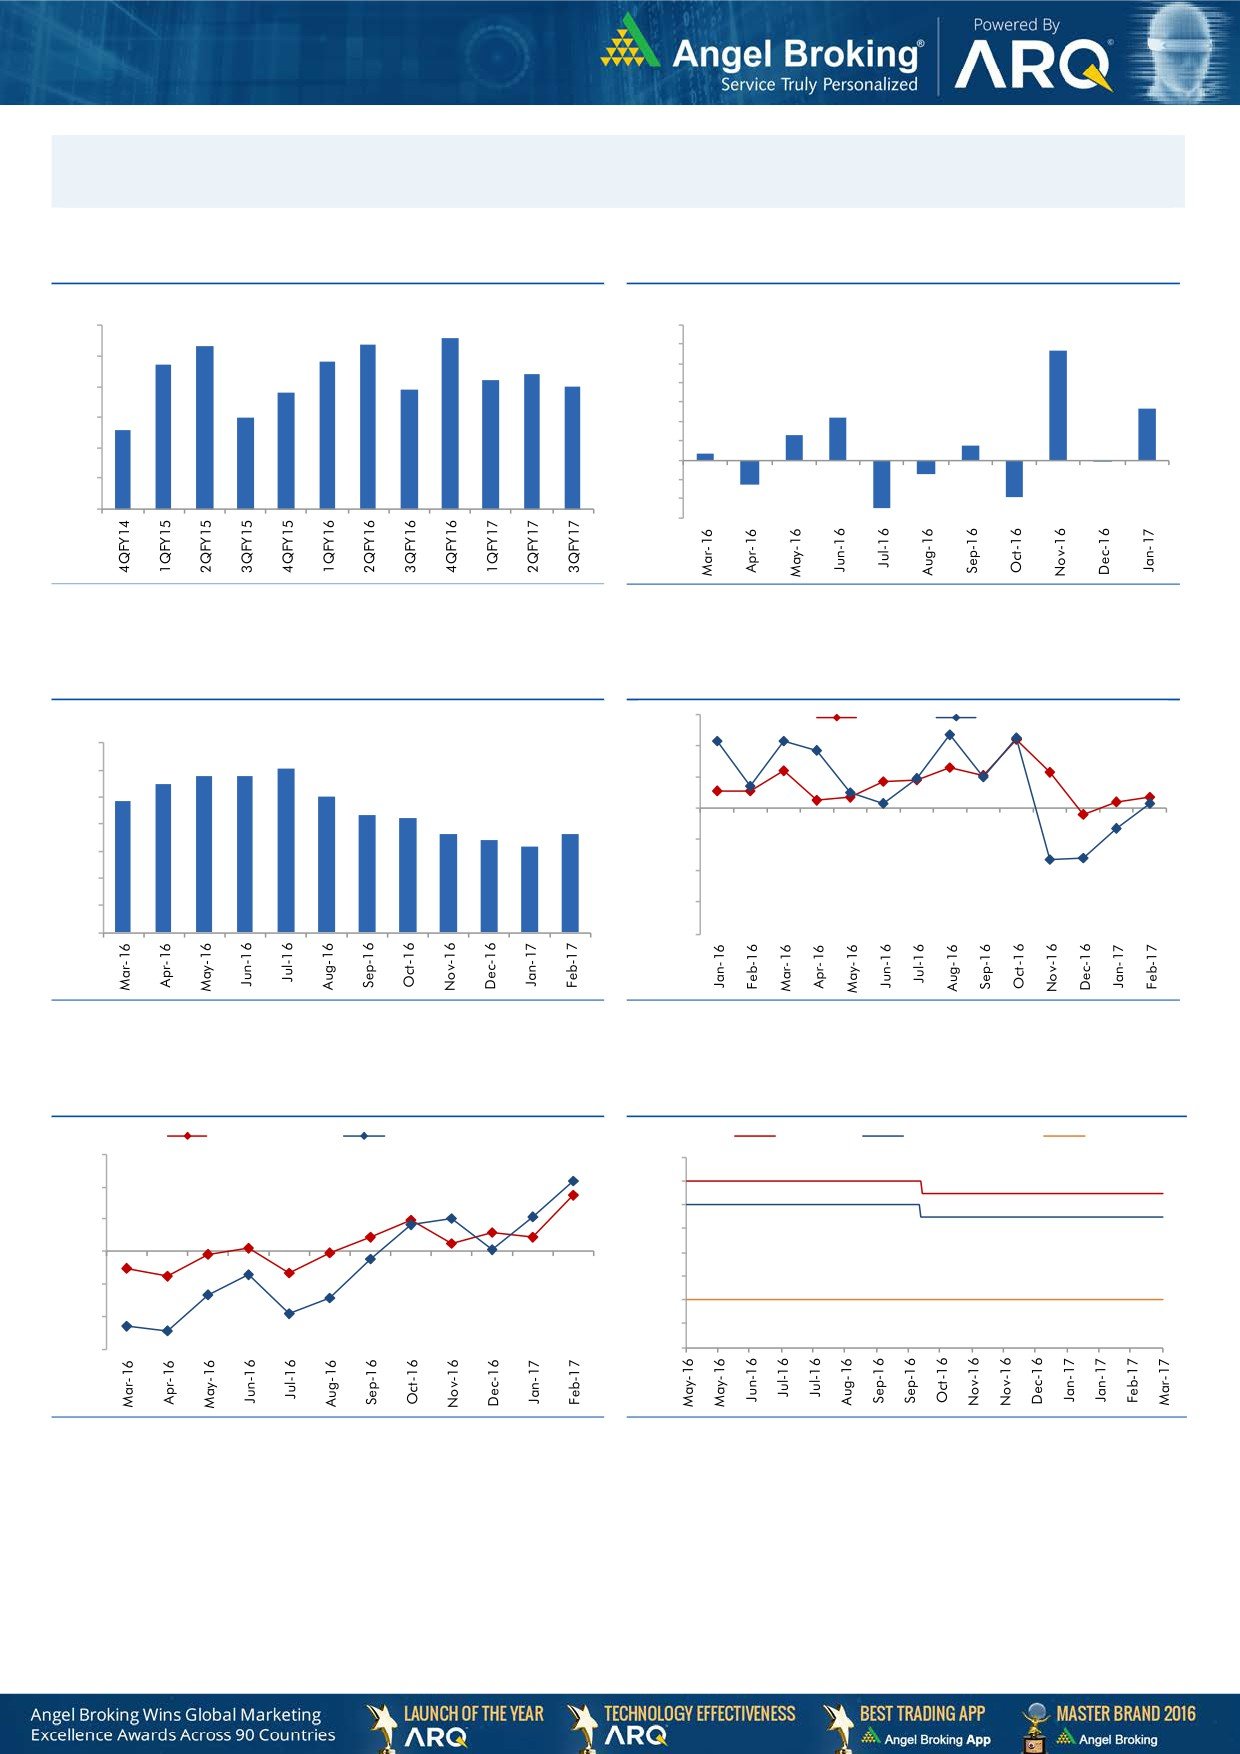
Macro watch
Exhibit 1: Quarterly GDP trends
Exhibit 2: IIP trends
(%)
(%)
9.0
8.4
8.6
7.0
8.3
5.7
7.7
7.8
6.0
8.0
7.4
7.2
5.0
6.8
6.9
7.0
7.0
4.0
2.7
6.0
3.0
2.2
6.0
5.6
1.3
2.0
0.7
1.0
0.3
5.0
-
4.0
(1.0)
(0.1)
(0.7)
(2.0)
(1.3)
3.0
(1.9)
(3.0)
(2.5)
Source: CSO, Angel Research
Source: MOSPI, Angel Research
Exhibit 3: Monthly CPI inflation trends
Exhibit 4: Manufacturing and services PMI
56.0
Mfg. PMI
Services PMI
(%)
7.0
54.0
6.1
5.8
5.8
6.0
5.5
5.1
52.0
4.8
5.0
4.3
4.2
50.0
3.6
3.7
4.0
3.4
3.2
48.0
3.0
46.0
2.0
1.0
44.0
-
42.0
Source: MOSPI, Angel Research
Source: Market, Angel Research; Note: Level above 50 indicates expansion
Exhibit 5: Exports and imports growth trends
Exhibit 6: Key policy rates
(%)
Exports yoy growth
Imports yoy growth
(%)
Repo rate
Reverse Repo rate
CRR
30.0
7.00
6.50
20.0
6.00
10.0
5.50
0 .0
5.00
4.50
(10.0)
4.00
(20.0)
3.50
(30.0)
3.00
Source: Bloomberg, Angel Research
Source: RBI, Angel Research
Market Outlook
March 21, 2017
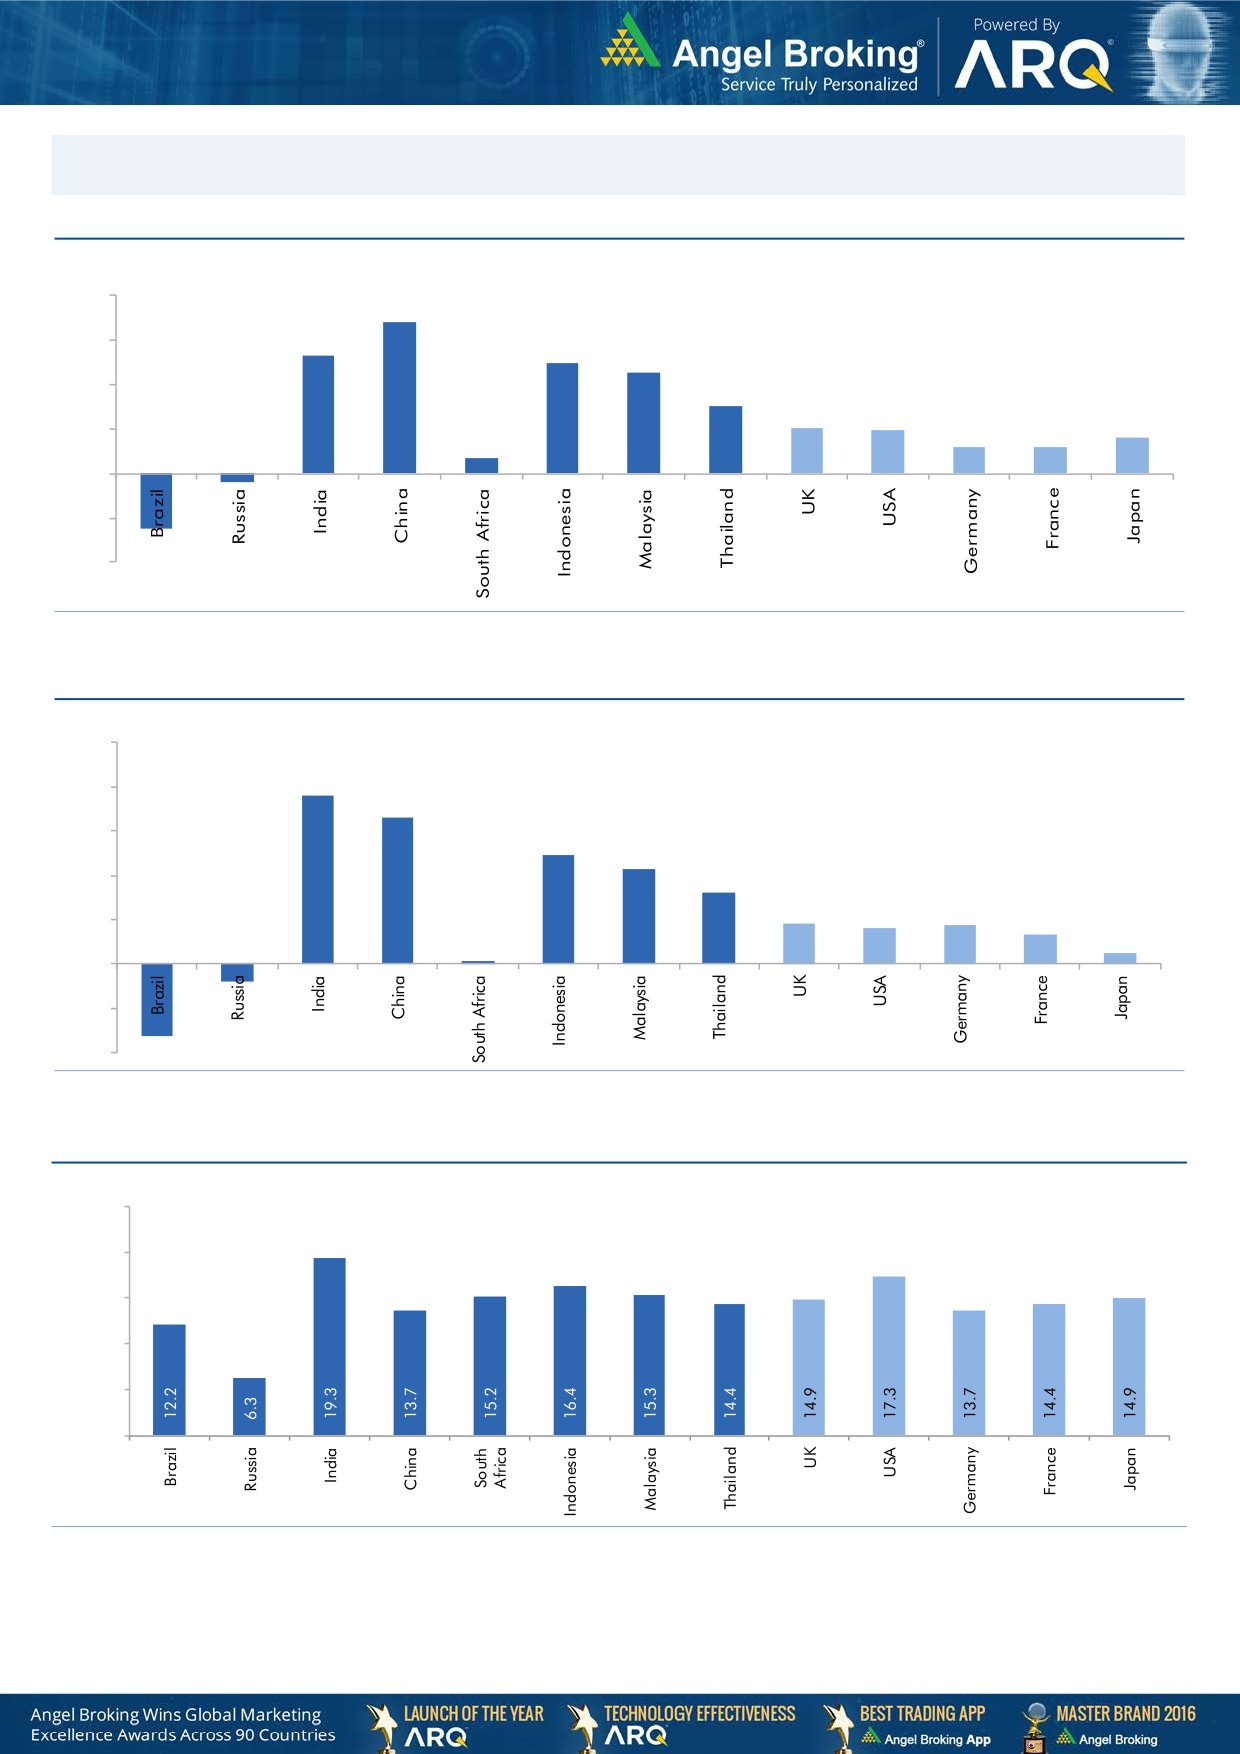
Global watch
Exhibit 1: Latest quarterly GDP Growth (%, yoy) across select developing and developed countries
(%)
8.0
6.8
0.7
5.3
6.0
4.9
4.5
4.0
3.0
2.0
1.9
1.2
1.2
1.6
2.0
-
(2.0)
(0.4)
(2.5)
(4.0)
Source: Bloomberg, Angel Research
Exhibit 2: 2016 GDP Growth projection by IMF (%, yoy) across select developing and developed countries
(%)
10.0
7.6
8.0
6.6
6.0
4.9
4.3
4.0
3.2
1.8
1.6
1.7
2.0
1.3
(0.8)
0.5
(3.3)
0.1
-
(2.0)
(4.0)
Source: IMF, Angel Research
Exhibit 3: One year forward P-E ratio across select developing and developed countries
(x)
25.0
20.0
15.0
10.0
5.0
-
Source: IMF, Angel Research
Market Outlook
March 21, 2017
Exhibit 4: Relative performance of indices across globe
Returns (%)
Country
Name of index
Closing price
1M
3M
1YR
Brazil
Bovespa
64,884
(2.7)
11.5
27.4
Russia
Micex
2,043
(4.6)
(8.7)
7.3
India
Nifty
9,127
3.8
11.9
21.5
China
Shanghai Composite
3,251
0.7
3.1
13.6
South Africa
Top 40
45,508
0.0
3.3
(2.8)
Mexico
Mexbol
48,593
3.0
7.7
6.5
Indonesia
LQ45
921
3.0
4.6
8.1
Malaysia
KLCI
1,749
2.4
6.3
2.9
Thailand
SET 50
990
0.3
4.5
11.4
USA
Dow Jones
20,906
1.4
5.6
18.6
UK
FTSE
7,430
2.1
6.2
20.0
Japan
Nikkei
19,522
0.4
1.4
17.3
Germany
DAX
12,053
2.5
5.5
21.9
France
CAC
5,012
2.3
3.9
14.3
Source: Bloomberg, Angel Research
Stock Watch
March 21, 2017
Company Name
Reco
CMP
Target
Mkt Cap
Sales ( Čcr )
OPM(%)
EPS (Č)
PER(x)
P/BV(x)
RoE(%)
EV/Sales(x)
(Č)
Price ( Č)
( Č cr )
FY17E
FY18E
FY17E
FY18E
FY17E
FY18E
FY17E
FY18E
FY17E
FY18E
FY17E
FY18E
FY17E
FY18E
6,577.0
6,907.0
Agri / Agri Chemical
Rallis
Neutral
255
-
4,951
1,937
2,164
13.3
14.3
9.0
11.0
28.3
23.2
4.9
4.3
18.4
19.8
2.6
2.3
United Phosphorus
Neutral
718
-
36,397
15,176
17,604
18.5
18.5
37.4
44.6
19.2
16.1
3.8
3.1
21.4
21.2
2.5
2.1
Auto & Auto Ancillary
Ashok Leyland
Buy
89
111
25,414
20,021
21,915
11.6
11.9
4.5
5.3
19.8
16.8
4.0
3.6
20.6
21.5
1.2
1.1
Bajaj Auto
Neutral
2,916
-
84,379
25,093
27,891
19.5
19.2
143.9
162.5
20.3
18.0
5.7
4.9
30.3
29.4
3.1
2.7
Bharat Forge
Neutral
1,037
-
24,143
7,726
8,713
20.5
21.2
35.3
42.7
29.4
24.3
5.4
4.9
18.9
20.1
3.2
2.8
Eicher Motors
Neutral
25,099
-
68,296
16,583
20,447
17.5
18.0
598.0
745.2
42.0
33.7
14.3
10.9
41.2
38.3
3.9
3.1
Gabriel India
Accumulate
118
130
1,699
1,544
1,715
9.0
9.3
5.4
6.3
21.9
18.8
4.1
3.7
18.9
19.5
1.1
0.9
Hero Motocorp
Neutral
3,340
-
66,698
28,083
30,096
15.3
15.7
171.8
187.0
19.4
17.9
6.8
5.7
30.1
27.9
2.2
2.0
Jamna Auto Industries Neutral
218
-
1,736
1,486
1,620
9.8
9.9
15.0
17.2
14.5
12.7
3.2
2.7
21.8
21.3
1.2
1.1
L G Balakrishnan & Bros Neutral
584
-
917
1,302
1,432
11.6
11.9
43.7
53.0
13.4
11.0
1.9
1.7
13.8
14.2
0.8
0.7
Mahindra and Mahindra Neutral
1,301
-
80,776
46,534
53,077
11.6
11.7
67.3
78.1
19.3
16.7
3.1
2.7
15.4
15.8
1.7
1.5
Maruti
Accumulate
6,164
6,560
186,201
67,822
83,288
16.0
16.4
253.8
312.4
24.3
19.7
5.6
4.5
23.0
22.9
2.4
1.9
Minda Industries
Neutral
436
-
3,455
2,728
3,042
9.0
9.1
68.2
86.2
6.4
5.1
1.5
1.2
23.8
24.3
1.3
1.2
Motherson Sumi
Neutral
370
-
51,982
45,896
53,687
7.8
8.3
13.0
16.1
28.4
23.0
9.2
7.3
34.7
35.4
1.2
1.0
Rane Brake Lining
Neutral
933
-
738
511
562
11.3
11.5
28.1
30.9
33.2
30.2
5.1
4.6
15.3
15.0
1.6
1.5
Setco Automotive
Neutral
35
-
464
741
837
13.0
13.0
15.2
17.0
2.3
2.0
0.4
0.3
15.8
16.3
1.0
0.9
Tata Motors
Neutral
476
-
137,452
300,209
338,549
8.9
8.4
42.7
54.3
11.2
8.8
1.8
1.5
15.6
17.2
0.6
0.5
TVS Motor
Neutral
438
-
20,828
13,390
15,948
6.9
7.1
12.8
16.5
34.4
26.5
8.5
6.8
26.3
27.2
1.6
1.3
Amara Raja Batteries
Buy
875
1,009
14,943
5,305
6,100
16.0
16.3
28.4
34.0
30.8
25.7
5.9
5.0
19.3
19.3
2.8
2.4
Exide Industries
Neutral
220
-
18,666
7,439
8,307
15.0
15.0
8.1
9.3
27.1
23.6
3.8
3.4
14.3
16.7
2.1
1.9
Apollo Tyres
Buy
203
235
10,331
12,877
14,504
14.3
13.9
21.4
23.0
9.5
8.8
1.5
1.3
16.4
15.2
1.0
0.9
Ceat
Accumulate
1,280
1,450
5,179
7,524
8,624
13.0
12.7
131.1
144.3
9.8
8.9
1.8
1.5
19.8
18.6
0.8
0.7
JK Tyres
Neutral
132
-
2,997
7,455
8,056
15.0
15.0
21.8
24.5
6.1
5.4
1.3
1.0
22.8
21.3
0.5
0.4
Swaraj Engines
Neutral
1,381
-
1,715
660
810
15.2
16.4
54.5
72.8
25.3
19.0
7.9
7.2
31.5
39.2
2.4
1.9
Subros
Neutral
198
-
1,186
1,488
1,681
11.7
11.9
6.4
7.2
30.9
27.6
3.3
3.0
10.8
11.4
1.0
0.9
Indag Rubber
Neutral
187
-
492
286
326
19.8
16.8
11.7
13.3
16.0
14.1
2.7
2.5
17.8
17.1
1.4
1.2
Capital Goods
ACE
Neutral
53
-
528
709
814
4.1
4.6
1.4
2.1
38.1
25.4
1.6
1.5
4.4
6.0
0.9
0.8
Stock Watch
March 21, 2017
Company Name
Reco
CMP
Target
Mkt Cap
Sales ( Čcr )
OPM(%)
EPS (Č)
PER(x)
P/BV(x)
RoE(%)
EV/Sales(x)
(Č)
Price ( Č)
( Č cr )
FY17E
FY18E
FY17E
FY18E
FY17E
FY18E
FY17E
FY18E
FY17E
FY18E
FY17E
FY18E
FY17E
FY18E
Capital Goods
BEML
Neutral
1,299
-
5,410
3,451
4,055
6.3
9.2
31.4
57.9
41.4
22.4
2.5
2.3
6.3
10.9
1.7
1.4
Bharat Electronics
Neutral
163
-
36,296
8,137
9,169
16.8
17.2
58.7
62.5
2.8
2.6
0.4
0.4
44.6
46.3
3.4
3.1
Voltas
Neutral
390
-
12,914
6,511
7,514
7.9
8.7
12.9
16.3
30.3
23.9
5.4
4.8
16.7
18.5
1.7
1.5
BGR Energy
Neutral
141
-
1,019
16,567
33,848
6.0
5.6
7.8
5.9
18.1
23.9
1.0
1.0
4.7
4.2
0.2
0.1
BHEL
Neutral
170
-
41,695
28,797
34,742
-
2.8
2.3
6.9
74.1
24.7
1.3
1.2
1.3
4.8
1.1
0.8
Blue Star
Neutral
611
-
5,837
4,283
5,077
5.9
7.3
14.9
22.1
41.0
27.6
8.0
6.7
20.4
26.4
1.4
1.2
CG Power and Industrial
Neutral
74
-
4,613
5,777
6,120
5.9
7.0
3.3
4.5
22.3
16.4
1.0
0.9
4.4
5.9
0.8
0.6
Solutions
Greaves Cotton
Neutral
167
-
4,075
1,755
1,881
16.8
16.9
7.8
8.5
21.4
19.6
4.3
4.0
20.6
20.9
2.0
1.8
Inox Wind
Neutral
180
-
3,985
5,605
6,267
15.7
16.4
24.8
30.0
7.2
6.0
2.0
1.5
25.9
24.4
0.8
0.6
KEC International
Neutral
177
-
4,548
9,294
10,186
7.9
8.1
9.9
11.9
17.9
14.9
2.6
2.3
15.6
16.3
0.7
0.7
KEI Industries
Buy
173
207
1,348
2,682
3,058
10.4
10.0
11.7
12.8
14.8
13.5
3.0
2.5
20.1
18.2
0.7
0.6
Thermax
Neutral
910
-
10,843
5,421
5,940
7.3
7.3
25.7
30.2
35.4
30.1
4.3
3.9
12.2
13.1
1.9
1.7
VATech Wabag
Accumulate
595
681
3,249
3,136
3,845
8.9
9.1
26.0
35.9
22.9
16.6
2.9
2.4
13.4
15.9
0.9
0.7
Cement
ACC
Neutral
1,409
-
26,459
11,225
13,172
13.2
16.9
44.5
75.5
31.7
18.7
3.0
2.8
11.2
14.2
2.4
2.0
Ambuja Cements
Neutral
234
-
46,494
9,350
10,979
18.2
22.5
5.8
9.5
40.4
24.7
3.4
3.0
10.2
12.5
5.0
4.2
India Cements
Neutral
162
-
4,967
4,364
4,997
18.5
19.2
7.9
11.3
20.5
14.3
1.5
1.4
8.0
8.5
1.9
1.7
JK Cement
Neutral
895
-
6,257
4,398
5,173
15.5
17.5
31.2
55.5
28.7
16.1
3.4
3.0
12.0
15.5
2.0
1.6
J K Lakshmi Cement
Neutral
428
-
5,030
2,913
3,412
14.5
19.5
7.5
22.5
57.0
19.0
3.5
3.0
12.5
18.0
2.3
1.9
Orient Cement
Neutral
133
-
2,731
2,114
2,558
18.5
20.5
8.1
11.3
16.5
11.8
2.4
2.1
9.0
14.0
1.9
1.5
UltraTech Cement
Neutral
4,024
-
110,459
25,768
30,385
21.0
23.5
111.0
160.0
36.3
25.2
4.6
4.0
13.5
15.8
4.4
3.7
Construction
ITNL
Neutral
106
-
3,480
8,946
10,017
31.0
31.6
8.1
9.1
13.1
11.6
0.5
0.5
4.2
5.0
3.7
3.5
KNR Constructions
Neutral
181
-
2,549
1,385
1,673
14.7
14.0
41.2
48.5
4.4
3.7
0.8
0.7
14.9
15.2
1.9
1.6
Larsen & Toubro
Accumulate
1,538
1,700
143,513
111,017
124,908
11.0
11.0
61.1
66.7
25.2
23.1
3.0
2.8
13.1
12.9
2.3
2.1
Gujarat Pipavav Port
Neutral
166
-
8,025
705
788
52.2
51.7
5.0
5.6
33.2
29.6
3.3
2.9
11.2
11.2
11.0
9.4
Nagarjuna Const.
Neutral
84
-
4,667
8,842
9,775
9.1
8.8
5.3
6.4
15.8
13.1
1.3
1.2
8.2
9.1
0.7
0.6
PNC Infratech
Buy
114
143
2,930
2,350
2,904
13.1
13.2
9.0
8.8
12.7
13.0
0.5
0.4
15.9
13.9
1.4
1.1
Simplex Infra
Neutral
311
-
1,537
6,829
7,954
10.5
10.5
31.4
37.4
9.9
8.3
1.0
0.9
9.9
13.4
0.7
0.6
Power Mech Projects
Neutral
510
-
750
1,801
2,219
12.7
14.6
72.1
113.9
7.1
4.5
1.3
1.1
16.8
11.9
0.4
0.3
Sadbhav Engineering
Neutral
313
-
5,374
3,598
4,140
10.3
10.6
9.0
11.9
34.8
26.3
3.6
3.2
9.9
11.9
1.8
1.5
Stock Watch
March 21, 2017
Company Name
Reco
CMP
Target
Mkt Cap
Sales ( Čcr )
OPM(%)
EPS (Č)
PER(x)
P/BV(x)
RoE(%)
EV/Sales(x)
(Č)
Price ( Č)
( Č cr )
FY17E
FY18E
FY17E
FY18E
FY17E
FY18E
FY17E
FY18E
FY17E
FY18E
FY17E
FY18E
FY17E
FY18E
Construction
NBCC
Neutral
176
-
15,840
7,428
9,549
7.9
8.6
8.2
11.0
21.5
16.0
1.1
0.8
28.2
28.7
1.8
1.4
MEP Infra
Neutral
53
-
854
1,877
1,943
30.6
29.8
3.0
4.2
17.5
12.5
8.5
5.7
0.6
0.6
1.8
1.7
SIPL
Neutral
97
-
3,417
1,036
1,252
65.5
66.2
(8.4)
(5.6)
3.6
4.2
(22.8)
(15.9)
11.5
9.6
Engineers India
Neutral
155
-
10,438
1,725
1,935
16.0
19.1
11.4
13.9
13.6
11.1
1.9
1.8
13.4
15.3
5.0
4.5
Financials
Axis Bank
Accumulate
505
580
120,754
46,932
53,575
3.5
3.4
32.4
44.6
15.6
11.3
2.0
1.7
13.6
16.5
-
-
Bank of Baroda
Neutral
166
-
38,145
19,980
23,178
1.8
1.8
11.5
17.3
14.4
9.6
1.7
1.4
8.3
10.1
-
-
Canara Bank
Neutral
294
-
15,959
15,225
16,836
1.8
1.8
14.5
28.0
20.3
10.5
1.4
1.1
5.8
8.5
-
-
Can Fin Homes
Neutral
2,091
-
5,566
420
526
3.5
3.5
86.5
107.8
24.2
19.4
5.2
4.3
23.6
24.1
-
-
Cholamandalam Inv. &
Buy
975
1,230
15,230
2,012
2,317
6.3
6.3
42.7
53.6
22.8
18.2
3.6
3.1
16.9
18.3
-
-
Fin. Co.
Dewan Housing Finance Neutral
362
-
11,328
2,225
2,688
2.9
2.9
29.7
34.6
12.2
10.5
2.0
1.7
16.1
16.8
-
-
Equitas Holdings
Buy
163
235
5,498
939
1,281
11.7
11.5
5.8
8.2
28.1
19.9
2.4
2.2
10.9
11.5
-
-
Federal Bank
Neutral
87
-
14,964
8,259
8,995
3.0
3.0
4.3
5.6
20.2
15.5
1.7
1.6
8.5
10.1
-
-
HDFC
Neutral
1,458
-
231,475
11,475
13,450
3.4
3.4
45.3
52.5
32.2
27.8
6.2
5.5
20.2
20.5
-
-
HDFC Bank
Neutral
1,435
-
367,371
46,097
55,433
4.5
4.5
58.4
68.0
24.6
21.1
4.3
3.6
18.8
18.6
-
-
ICICI Bank
Accumulate
275
315
160,222
42,800
44,686
3.1
3.3
18.0
21.9
15.3
12.6
2.1
1.9
11.1
12.3
-
-
Lakshmi Vilas Bank
Accumulate
165
174
3,153
3,339
3,799
2.7
2.8
11.0
14.0
15.0
11.8
1.6
1.4
11.2
12.7
-
-
LIC Housing Finance
Accumulate
591
630
29,808
3,712
4,293
2.6
2.5
39.0
46.0
15.1
12.8
2.8
2.4
19.9
20.1
-
-
Punjab Natl.Bank
Neutral
145
-
30,877
23,532
23,595
2.3
2.4
6.8
12.6
21.3
11.5
3.3
2.3
3.3
6.5
-
-
RBL Bank
Neutral
498
-
18,426
1,783
2,309
2.6
2.6
12.7
16.4
39.2
30.4
4.3
3.8
12.8
13.3
-
-
Repco Home Finance
Buy
675
825
4,225
388
457
4.5
4.2
30.0
38.0
22.5
17.8
3.8
3.2
18.0
19.2
-
-
South Ind.Bank
Neutral
20
-
2,758
6,435
7,578
2.5
2.5
2.7
3.1
7.6
6.6
1.0
0.8
10.1
11.2
-
-
St Bk of India
Neutral
274
-
218,474
88,650
98,335
2.6
2.6
13.5
18.8
20.3
14.6
1.9
1.7
7.0
8.5
-
-
Union Bank
Neutral
158
-
10,838
13,450
14,925
2.3
2.3
25.5
34.5
6.2
4.6
0.9
0.8
7.5
10.2
-
-
Yes Bank
Neutral
1,513
-
64,110
8,978
11,281
3.3
3.4
74.0
90.0
20.5
16.8
3.9
3.3
17.0
17.2
-
-
FMCG
Akzo Nobel India
Accumulate
1,600
1,720
7,674
2,955
3,309
13.3
13.7
57.2
69.3
28.0
23.1
9.1
7.7
32.7
33.3
2.4
2.1
Asian Paints
Neutral
1,081
-
103,656
17,128
18,978
16.8
16.4
19.1
20.7
56.6
52.2
19.7
18.6
34.8
35.5
6.0
5.4
Britannia
Accumulate
3,245
3,626
38,940
9,594
11,011
14.6
14.9
80.3
94.0
40.4
34.5
16.6
12.8
41.2
-
3.9
3.4
Colgate
Neutral
983
-
26,748
4,605
5,149
23.4
23.4
23.8
26.9
41.3
36.6
22.9
17.9
64.8
66.8
5.7
5.1
Dabur India
Accumulate
280
304
49,261
8,315
9,405
19.8
20.7
8.1
9.2
34.5
30.4
9.6
8.0
31.6
31.0
5.6
4.9
Stock Watch
March 21, 2017
Company Name
Reco
CMP
Target
Mkt Cap
Sales ( Čcr )
OPM(%)
EPS (Č)
PER(x)
P/BV(x)
RoE(%)
EV/Sales(x)
(Č)
Price ( Č)
( Č cr )
FY17E FY18E
FY17E
FY18E
FY17E
FY18E
FY17E
FY18E
FY17E
FY18E
FY17E
FY18E
FY17E
FY18E
FMCG
GlaxoSmith Con*
Neutral
5,454
-
22,938
4,350
4,823
21.2
21.4
179.2
196.5
30.4
27.8
8.1
6.8
27.1
26.8
4.7
4.1
Godrej Consumer
Neutral
1,694
-
57,686
10,235
11,428
18.4
18.6
41.1
44.2
41.2
38.3
9.1
7.7
24.9
24.8
5.7
5.1
HUL
Neutral
898
-
194,441
35,252
38,495
17.8
17.8
20.7
22.4
43.5
40.1
41.6
35.7
95.6
88.9
5.4
4.9
ITC
Neutral
282
-
342,470
40,059
44,439
38.3
39.2
9.0
10.1
31.4
27.8
8.8
7.7
27.8
27.5
8.1
7.2
Marico
Neutral
292
-
37,737
6,430
7,349
18.8
19.5
6.4
7.7
45.7
38.0
13.8
11.6
33.2
32.5
5.7
4.9
Nestle*
Neutral
6,300
-
60,742
10,073
11,807
20.7
21.5
124.8
154.2
50.5
40.9
20.7
18.6
34.8
36.7
5.8
5.0
Tata Global
Neutral
147
-
9,246
8,675
9,088
9.8
9.8
7.4
8.2
19.8
17.9
1.6
1.5
7.9
8.1
1.0
0.9
Procter & Gamble
Accumulate
6,784
7,369
22,020
2,939
3,342
23.2
23.0
146.2
163.7
46.4
41.4
11.8
9.8
25.3
23.5
7.0
6.1
Hygiene
IT
HCL Tech^
Buy
863
1,000
121,831
49,242
57,168
20.5
20.5
55.7
64.1
15.5
13.5
3.2
2.4
20.3
17.9
2.3
1.9
Infosys
Buy
1,021
1,249
234,426
68,350
77,326
27.0
27.0
62.5
69.4
16.3
14.7
3.5
3.2
21.3
21.6
2.9
2.5
TCS
Accumulate
2,481
2,700
488,824
119,025
133,308
27.6
27.6
131.2
145.5
18.9
17.1
6.1
5.6
32.4
33.1
3.9
3.4
Tech Mahindra
Buy
480
600
46,730
29,673
32,937
15.5
17.0
32.8
39.9
14.6
12.0
2.9
2.5
19.6
20.7
1.3
1.1
Wipro
Buy
496
583
120,512
55,440
60,430
18.1
18.1
36.1
38.9
13.7
12.7
2.5
2.3
19.0
17.6
1.9
1.7
Media
D B Corp
Neutral
385
-
7,081
2,297
2,590
27.4
28.2
21.0
23.4
18.3
16.5
4.3
3.7
23.7
23.1
2.9
2.5
HT Media
Neutral
85
-
1,967
2,693
2,991
12.6
12.9
7.9
9.0
10.7
9.4
0.9
0.8
7.8
8.3
0.3
0.2
Jagran Prakashan
Buy
176
225
5,739
2,355
2,635
28.0
28.0
10.8
12.5
16.3
14.1
3.5
3.1
21.7
21.7
2.5
2.2
Sun TV Network
Neutral
763
-
30,069
2,850
3,265
70.1
71.0
26.2
30.4
29.1
25.1
7.5
6.6
24.3
25.6
10.1
8.7
Hindustan Media
Neutral
293
-
2,148
1,016
1,138
24.3
25.2
27.3
30.1
10.7
9.7
2.0
1.8
16.2
15.8
1.4
1.3
Ventures
TV Today Network
Buy
255
344
1,521
567
645
26.7
27.0
15.4
18.1
16.6
14.1
2.5
2.2
14.9
15.2
2.3
1.9
Metals & Mining
Coal India
Neutral
292
-
181,225
84,638
94,297
21.4
22.3
24.5
27.1
11.9
10.8
5.0
4.7
42.6
46.0
1.7
1.5
Hind. Zinc
Neutral
312
-
131,640
14,252
18,465
55.9
48.3
15.8
21.5
19.7
14.5
3.2
2.8
17.0
20.7
9.2
7.1
Hindalco
Neutral
196
-
40,450
107,899
112,095
7.4
8.2
9.2
13.0
21.3
15.1
1.0
1.0
4.8
6.6
0.9
0.8
JSW Steel
Neutral
194
-
46,773
53,201
58,779
16.1
16.2
130.6
153.7
1.5
1.3
0.2
0.2
14.0
14.4
1.6
1.4
NMDC
Neutral
137
-
43,472
6,643
7,284
44.4
47.7
7.1
7.7
19.4
17.8
1.7
1.6
8.8
9.2
4.3
3.9
SAIL
Neutral
64
-
26,350
47,528
53,738
(0.7)
2.1
(1.9)
2.6
24.5
0.7
0.7
(1.6)
3.9
1.4
1.3
Vedanta
Neutral
263
-
78,060
71,744
81,944
19.2
21.7
13.4
20.1
19.7
13.1
1.7
1.5
8.4
11.3
1.5
1.2
Tata Steel
Neutral
497
-
48,245
121,374
121,856
7.2
8.4
18.6
34.3
26.7
14.5
1.7
1.5
6.1
10.1
1.0
1.0
Oil & Gas
Cairn India
Neutral
294
-
55,057
9,127
10,632
4.3
20.6
8.8
11.7
33.4
25.1
1.1
1.0
3.3
4.2
7.5
6.3
GAIL
Neutral
377
-
63,678
56,220
65,198
9.3
10.1
27.1
33.3
13.9
11.3
1.3
1.2
9.3
10.7
1.3
1.1
Stock Watch
March 21, 2017
Company Name
Reco
CMP
Target
Mkt Cap
Sales ( Čcr )
OPM(%)
EPS (Č)
PER(x)
P/BV(x)
RoE(%)
EV/Sales(x)
(Č)
Price ( Č)
( Č cr )
FY17E FY18E
FY17E
FY18E
FY17E
FY18E
FY17E
FY18E
FY17E
FY18E
FY17E
FY18E
FY17E
FY18E
Oil & Gas
ONGC
Neutral
191
-
244,666
137,222
152,563
15.0
21.8
19.5
24.1
9.8
7.9
0.8
0.8
8.5
10.1
2.1
1.8
Indian Oil Corp
Neutral
371
-
180,130
373,359
428,656
5.9
5.5
54.0
59.3
6.9
6.3
1.1
1.0
16.0
15.6
0.6
0.5
Reliance Industries
Neutral
1,280
-
415,343
301,963
358,039
12.1
12.6
87.7
101.7
14.6
12.6
1.5
1.4
10.7
11.3
1.9
1.5
Pharmaceuticals
Alembic Pharma
Accumulate
599
689
11,295
3,483
4,244
20.2
21.4
24.3
33.6
24.7
17.8
5.6
4.5
25.5
25.3
3.2
2.5
Alkem Laboratories Ltd
Accumulate
2,104
2,257
25,160
6,065
7,009
18.7
20.0
80.2
92.0
26.2
22.9
5.9
4.9
22.5
21.6
4.1
3.5
Aurobindo Pharma
Buy
703
877
41,198
15,720
18,078
23.7
23.7
41.4
47.3
17.0
14.9
4.4
3.5
29.6
26.1
2.8
2.5
Aventis*
Neutral
4,458
-
10,267
2,277
2,597
16.6
17.4
128.9
157.0
34.6
28.4
5.9
4.5
21.6
26.4
4.3
3.6
Cadila Healthcare
Neutral
446
-
45,638
10,429
12,318
17.7
21.6
13.1
19.2
34.0
23.2
7.1
5.7
22.8
27.1
4.4
3.6
Cipla
Sell
597
465
47,991
15,378
18,089
15.7
16.8
19.3
24.5
30.9
24.4
3.6
3.2
12.3
13.9
3.3
2.8
Dr Reddy's
Neutral
2,740
-
45,393
16,043
18,119
18.0
23.0
78.6
130.9
34.9
20.9
3.4
3.0
10.1
15.2
2.6
2.5
Dishman Pharma
Sell
240
143
3,881
1,718
1,890
22.7
22.8
9.5
11.3
25.3
21.3
2.5
2.2
10.1
10.9
2.7
2.4
GSK Pharma*
Neutral
2,755
-
23,336
2,800
3,290
10.2
20.6
32.2
60.3
85.6
45.7
15.8
15.7
17.2
34.5
8.1
6.9
Indoco Remedies
Reduce
257
240
2,368
1,112
1,289
16.2
18.2
11.6
16.0
22.2
16.1
3.5
3.0
17.0
20.1
2.3
1.9
Ipca labs
Accumulate
547
613
6,897
3,258
3,747
12.8
15.3
12.1
19.2
45.2
28.5
2.8
2.6
6.4
9.5
2.2
2.0
Lupin
Buy
1,463
1,809
66,039
15,912
18,644
26.4
26.7
58.1
69.3
25.2
21.1
4.9
4.0
21.4
20.9
4.2
3.5
Sun Pharma
Buy
707
847
169,686
31,129
35,258
32.0
32.9
30.2
35.3
23.4
20.0
3.8
3.1
20.0
20.1
5.0
4.2
Power
Tata Power
Neutral
87
-
23,477
36,916
39,557
17.4
27.1
5.1
6.3
17.0
13.8
1.5
1.4
9.0
10.3
1.6
1.5
NTPC
Neutral
162
-
133,164
86,605
95,545
17.5
20.8
11.8
13.4
13.7
12.1
1.4
1.3
10.5
11.1
2.9
2.9
Power Grid
Buy
194
223
101,231
25,315
29,193
88.2
88.7
14.2
17.2
13.7
11.3
2.1
1.8
15.2
16.1
8.6
7.8
Real Estate
Prestige Estate
Accumulate
185
210
6,930
4,707
5,105
25.2
26.0
10.3
13.0
17.9
14.2
1.4
1.3
10.3
10.2
2.6
2.3
MLIFE
Buy
375
522
1,537
1,152
1,300
22.7
24.6
29.9
35.8
12.5
10.5
0.9
0.9
7.6
8.6
2.1
1.7
Telecom
Bharti Airtel
Neutral
349
-
139,689
105,086
114,808
34.5
34.7
12.2
16.4
28.6
21.3
1.9
1.8
6.8
8.4
2.2
2.0
Idea Cellular
Neutral
98
-
35,170
40,133
43,731
37.2
37.1
6.4
6.5
15.3
15.0
1.3
1.2
8.2
7.6
1.9
1.6
zOthers
Abbott India
Neutral
4,500
-
9,562
3,153
3,583
14.1
14.4
152.2
182.7
29.6
24.6
145.2
124.0
25.6
26.1
2.7
2.4
Asian Granito
Neutral
344
-
1,034
1,060
1,169
12.2
12.5
12.7
15.9
27.1
21.6
2.6
2.3
9.5
10.7
1.3
1.1
Bajaj Electricals
Accumulate
311
330
3,147
4,801
5,351
5.7
6.2
10.4
13.7
29.8
22.7
3.7
3.3
12.4
14.5
0.7
0.6
Banco Products (India)
Neutral
202
-
1,444
1,353
1,471
12.3
12.4
14.5
16.3
13.9
12.4
19.2
17.3
14.5
14.6
1.0
108.0
Coffee Day Enterprises
Neutral
234
-
4,812
2,964
3,260
20.5
21.2
4.7
8.0
-
29.2
2.7
2.5
5.5
8.5
2.0
1.8
Ltd
Competent Automobiles Neutral
178
-
109
1,137
1,256
3.1
2.7
28.0
23.6
6.4
7.5
34.2
30.9
14.3
11.5
0.1
0.1
Stock Watch
March 21, 2017
Company Name
Reco
CMP
Target
Mkt Cap
Sales ( Čcr )
OPM(%)
EPS (Č)
PER(x)
P/BV(x)
RoE(%)
EV/Sales(x)
(Č)
Price ( Č)
( Č cr )
FY17E
FY18E
FY17E
FY18E
FY17E
FY18E
FY17E
FY18E
FY17E
FY18E
FY17E
FY18E
FY17E
FY18E
zOthers
Elecon Engineering
Neutral
53
-
592
1,482
1,660
13.7
14.5
3.9
5.8
13.5
9.1
3.2
2.9
7.8
10.9
0.7
0.6
Finolex Cables
Neutral
460
-
7,028
2,883
3,115
12.0
12.1
14.2
18.6
32.4
24.7
17.2
15.0
15.8
14.6
2.1
1.9
Garware Wall Ropes
Neutral
695
-
1,521
863
928
15.1
15.2
36.4
39.4
19.1
17.6
3.5
3.0
17.5
15.9
1.7
1.5
Goodyear India*
Neutral
780
-
1,799
1,598
1,704
10.4
10.2
49.4
52.6
15.8
14.8
72.9
64.0
18.2
17.0
0.8
114.0
Hitachi
Neutral
1,519
-
4,129
2,081
2,433
8.8
8.9
33.4
39.9
45.5
38.1
36.7
30.6
22.1
21.4
2.0
1.7
HSIL
Neutral
321
-
2,317
2,384
2,515
15.8
16.3
15.3
19.4
21.0
16.5
20.8
17.9
7.8
9.3
1.1
1.0
Interglobe Aviation
Neutral
920
-
33,253
21,122
26,005
14.5
27.6
110.7
132.1
8.3
7.0
49.7
35.5
168.5
201.1
1.6
1.2
Jyothy Laboratories
Neutral
350
-
6,361
1,440
2,052
11.5
13.0
8.5
10.0
41.2
35.0
10.0
9.2
18.6
19.3
4.7
3.3
Kirloskar Engines India
Neutral
390
-
5,640
2,554
2,800
9.9
10.0
10.5
12.1
37.1
32.2
15.5
14.7
10.7
11.7
1.8
1.6
Ltd
Linc Pen & Plastics
Neutral
254
-
376
382
420
9.3
9.5
13.5
15.7
18.9
16.2
3.2
2.8
17.1
17.3
1.0
0.9
M M Forgings
Neutral
549
-
663
546
608
20.4
20.7
41.3
48.7
13.3
11.3
75.2
66.6
16.6
17.0
1.1
0.9
Manpasand Bever.
Neutral
737
-
4,216
836
1,087
19.6
19.4
16.9
23.8
43.6
30.9
5.2
4.6
12.0
14.8
4.8
3.6
Mirza International
Buy
89
107
1,066
963
1,069
17.2
18.0
6.1
7.5
14.5
11.8
2.2
1.9
15.0
15.7
1.3
1.2
MT Educare
Neutral
86
-
342
366
417
17.7
18.2
9.4
10.8
9.2
8.0
2.0
1.8
22.2
22.3
0.8
0.7
Narayana Hrudaya
Neutral
311
-
6,365
1,873
2,166
11.5
11.7
2.6
4.0
117.8
78.6
7.2
6.5
6.1
8.3
3.5
3.0
Navkar Corporation
Buy
175
265
2,498
369
561
42.9
42.3
6.9
11.5
25.4
15.2
1.8
1.6
7.4
10.5
7.8
5.1
Navneet Education
Neutral
142
-
3,314
1,062
1,147
24.0
24.0
6.1
6.6
23.3
21.4
4.8
4.2
20.6
19.8
3.2
3.0
Nilkamal
Neutral
1,971
-
2,941
1,995
2,165
10.7
10.4
69.8
80.6
28.2
24.5
112.6
97.8
16.6
16.5
1.5
1.3
Page Industries
Neutral
14,603
-
16,288
2,450
3,124
20.1
17.6
299.0
310.0
48.8
47.1
325.2
248.3
47.1
87.5
6.7
5.3
Parag Milk Foods
Neutral
220
-
1,846
1,919
2,231
9.3
9.6
9.5
12.9
23.2
17.0
3.6
3.0
15.5
17.5
1.1
0.9
Quick Heal
Neutral
239
-
1,673
408
495
27.3
27.0
7.7
8.8
30.8
27.1
2.9
2.9
9.3
10.6
3.2
2.7
Radico Khaitan
Buy
125
147
1,660
1,667
1,824
13.0
13.2
6.7
8.2
18.8
15.2
1.7
1.6
9.0
10.2
1.4
1.2
Relaxo Footwears
Neutral
484
-
5,814
2,085
2,469
9.2
8.2
7.6
8.0
64.0
60.9
24.8
21.2
17.9
18.8
2.9
2.5
S H Kelkar & Co.
Neutral
306
-
4,426
1,036
1,160
15.1
15.0
6.1
7.2
50.1
42.6
5.4
4.9
10.7
11.5
4.1
3.7
Siyaram Silk Mills
Accumulate
1,670
1,872
1,565
1,652
1,857
11.6
11.7
92.4
110.1
18.1
15.2
2.7
2.3
14.7
15.2
1.2
1.0
Styrolution ABS India*
Neutral
601
-
1,057
1,440
1,537
9.2
9.0
40.6
42.6
14.8
14.1
37.8
34.4
12.3
11.6
0.7
0.6
Surya Roshni
Neutral
190
-
832
3,342
3,625
7.8
7.5
17.3
19.8
11.0
9.6
20.9
16.7
10.5
10.8
0.5
0.5
Team Lease Serv.
Neutral
971
-
1,659
3,229
4,001
1.5
1.8
22.8
32.8
42.6
29.6
4.6
4.0
10.7
13.4
0.4
0.3
The Byke Hospitality
Neutral
185
-
742
287
384
20.5
20.5
7.6
10.7
24.4
17.3
5.1
4.1
20.7
23.5
2.6
1.9
Stock Watch
March 21, 2017
Company Name
Reco
CMP
Target Mkt Cap
Sales ( Čcr )
OPM(%)
EPS (Č)
PER(x)
P/BV(x)
RoE(%)
EV/Sales(x)
(Č)
Price ( Č)
( Č cr )
FY17E FY18E FY17E FY18E FY17E FY18E FY17E FY18E FY17E FY18E FY17E FY18E FY17E FY18E
zOthers
Transport Corporation of
Neutral
228
-
1,749
2,671
2,911
8.5
8.8
13.9
15.7
16.5
14.6
2.3
2.0
13.7
13.8
0.8
0.7
India
TVS Srichakra
Neutral
3,293
-
2,521
2,304
2,614
13.7
13.8
231.1
266.6
14.3
12.4
369.9
291.3
33.9
29.3
1.1
0.9
UFO Moviez
Neutral
434
-
1,196
619
685
33.2
33.4
30.0
34.9
14.5
12.4
2.0
1.7
13.8
13.9
1.6
1.3
Visaka Industries
Neutral
250
-
398
1,051
1,138
10.3
10.4
21.0
23.1
11.9
10.8
32.1
30.1
9.0
9.2
0.6
0.6
VRL Logistics
Neutral
300
-
2,735
1,902
2,119
16.7
16.6
14.6
16.8
20.6
17.8
4.5
4.0
21.9
22.2
1.6
1.4
VIP Industries
Accumulate
170
180
2,402
1,270
1,450
10.4
10.4
5.6
6.5
30.4
26.2
6.3
5.5
20.7
21.1
1.9
1.6
Source: Company, Angel Research; Note: *December year end; #September year end; &October year end; Price as on March 20, 2017
Market Outlook
March 21, 2017
Research Team Tel: 022 - 39357800
DISCLAIMER
Angel Broking Private Limited (hereinafter referred to as “Angel”) is a registered Member of National Stock Exchange of India
Limited,Bombay Stock Exchange Limited and Metropolitan Stock Exchange Limited. It is also registered as a Depository Participant with
CDSL and Portfolio Manager with SEBI. It also has registration with AMFI as a Mutual Fund Distributor. Angel Broking Private Limited is a
registered entity with SEBI for Research Analyst in terms of SEBI (Research Analyst) Regulations, 2014 vide registration number
INH000000164. Angel or its associates has not been debarred/ suspended by SEBI or any other regulatory authority for accessing
/dealing in securities Market. Angel or its associates/analyst has not received any compensation / managed or
co-managed public offering of securities of the company covered by Analyst during the past twelve months.
This document is solely for the personal information of the recipient, and must not be singularly used as the basis of any investment
decision. Nothing in this document should be construed as investment or financial advice. Each recipient of this document should make
such investigations as they deem necessary to arrive at an independent evaluation of an investment in the securities of the companies
referred to in this document (including the merits and risks involved), and should consult their own advisors to determine the merits and
risks of such an investment.
Reports based on technical and derivative analysis center on studying charts of a stock's price movement, outstanding positions and
trading volume, as opposed to focusing on a company's fundamentals and, as such, may not match with a report on a company's
fundamentals. Investors are advised to refer the Fundamental and Technical Research Reports available on our website to evaluate the
contrary view, if any.
The information in this document has been printed on the basis of publicly available information, internal data and other reliable
sources believed to be true, but we do not represent that it is accurate or complete and it should not be relied on as such, as this
document is for general guidance only. Angel Broking Pvt. Limited or any of its affiliates/ group companies shall not be in any way
responsible for any loss or damage that may arise to any person from any inadvertent error in the information contained in this report.
Angel Broking Pvt. Limited has not independently verified all the information contained within this document. Accordingly, we cannot
testify, nor make any representation or warranty, express or implied, to the accuracy, contents or data contained within this document.
While Angel Broking Pvt. Limited endeavors to update on a reasonable basis the information discussed in this material, there may be
regulatory, compliance, or other reasons that prevent us from doing so.
This document is being supplied to you solely for your information, and its contents, information or data may not be reproduced,
redistributed or passed on, directly or indirectly.
Neither Angel Broking Pvt. Limited, nor its directors, employees or affiliates shall be liable for any loss or damage that may arise from
or in connection with the use of this information.